I was on cloud nine after this nearly $5,000 gain. Yes I know, don’t lean into your emotions too much in this game, but I’d be lying if I said I didn’t have a pep in my step after this.
Overview of the entire move on a 5 min:
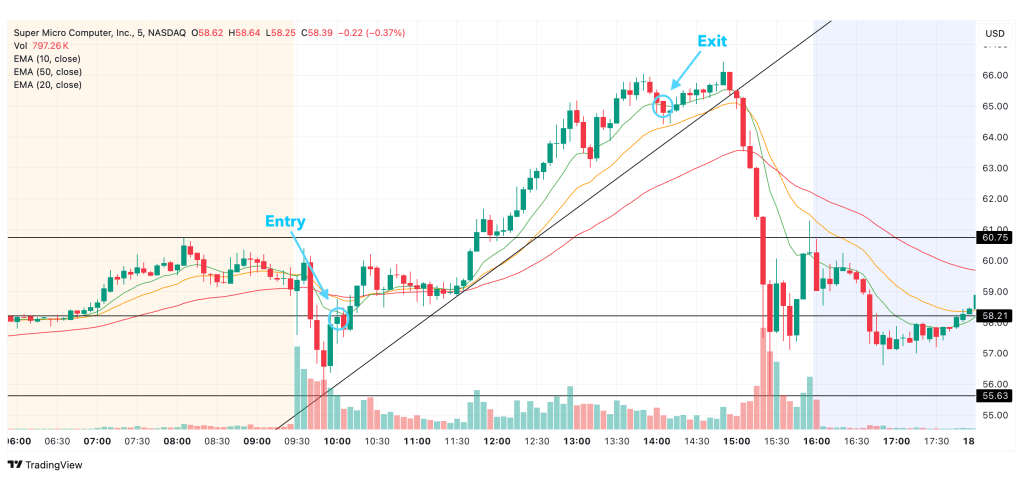
See that ugly downside? Yeah, we’ll get to that.
Strategy before market open
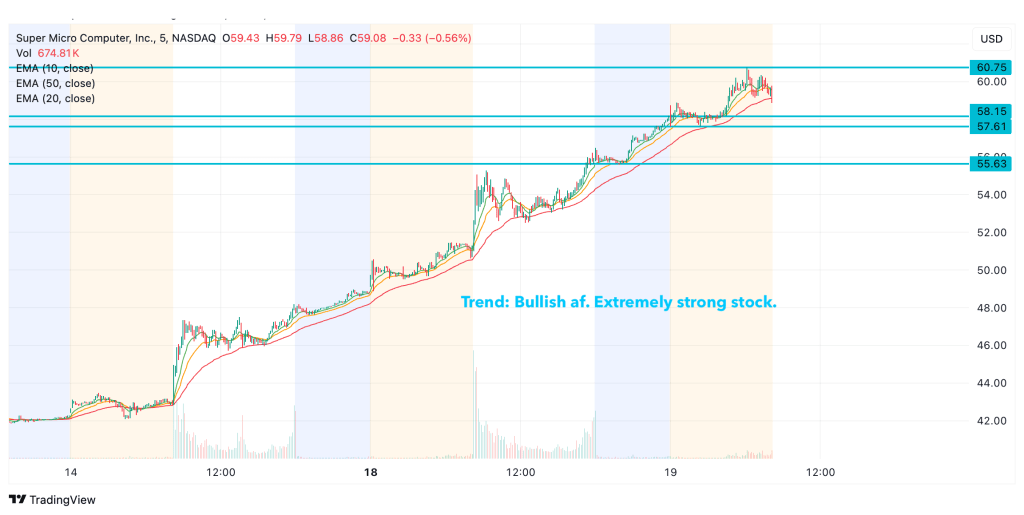
1. Determine the stock’s general trend.
The general trend of the stock decides if I’ll even consider trading today.
2. Draw support and resistance lines at:
- Pre-market high
- Pre-market low
- After-hours high
- After-hours low
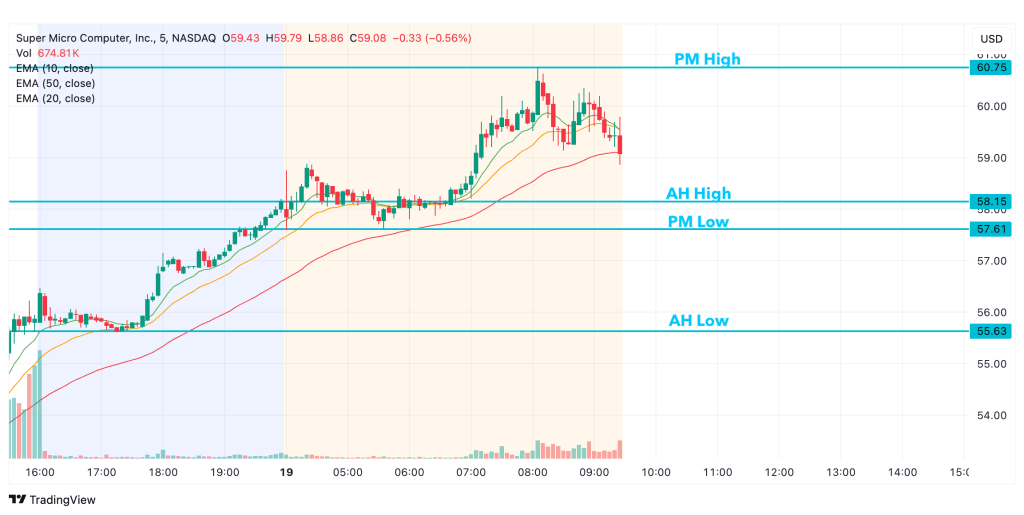
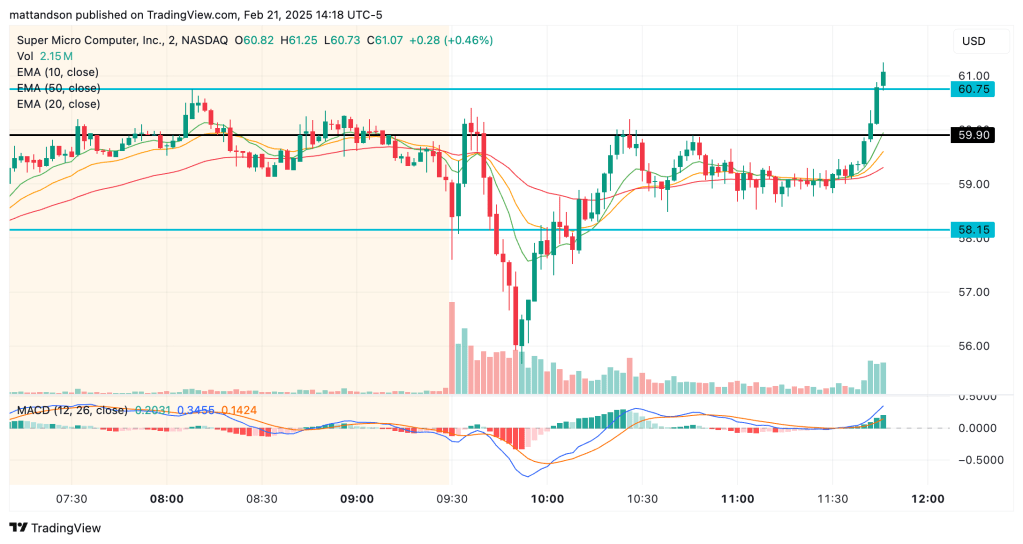
3. Notice pre-market movement
Technical: AH and PM were in solid uptrend. Small downtrend forms as we get closer to market open.
Analysis: May be small dump at open for profit-taking, then resume up.
4. Plan: Look for a dip into one of my support lines, enter, then ride it up.
Market opens soon, let the games begin. 😬
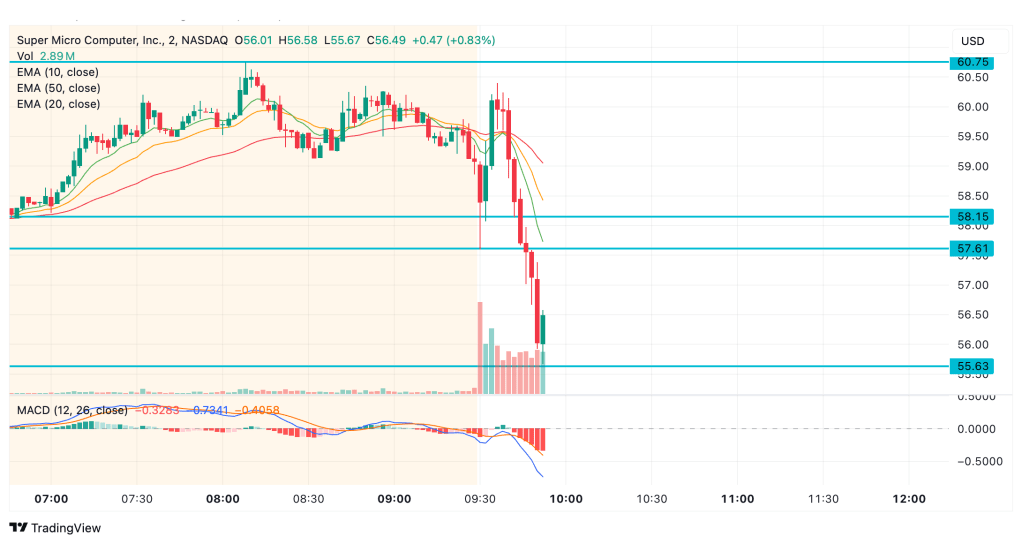
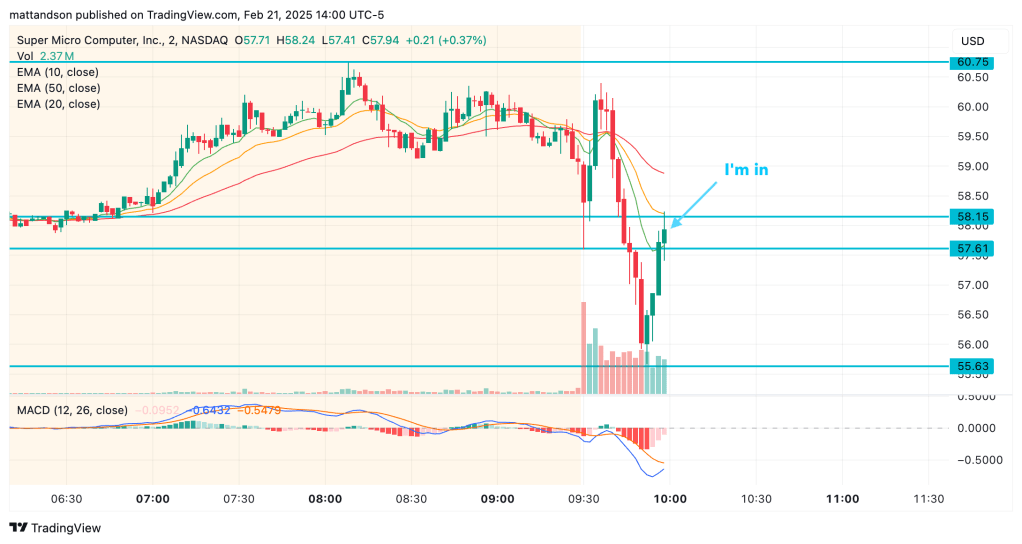
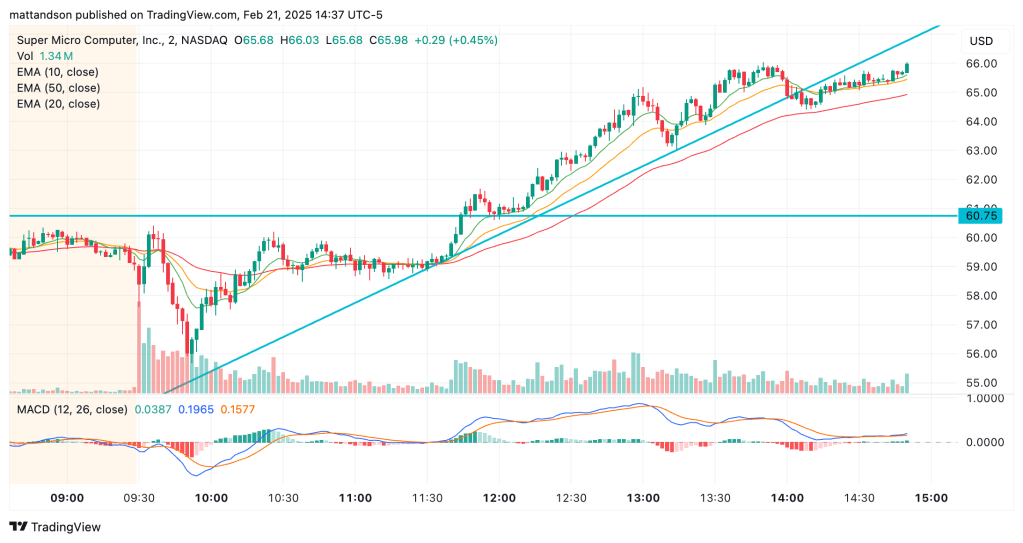
Technical: It dumps then bounces off bottom line. Rises to between second and third line. Small bounce on 10 EMA. All EMAs curling up. MACD curling up.
Analysis: People took profits. Now the selling steam is running out, and buyers are taking over again. General trend tells me that the buyers are not close to running out of steam yet over the longer term. We’re heading up, but watch how it acts at stop loss.
Mental stop loss: Below the second-to-bottom line. Yes, it’s tight. But I want a strong uptrend or I’m out.
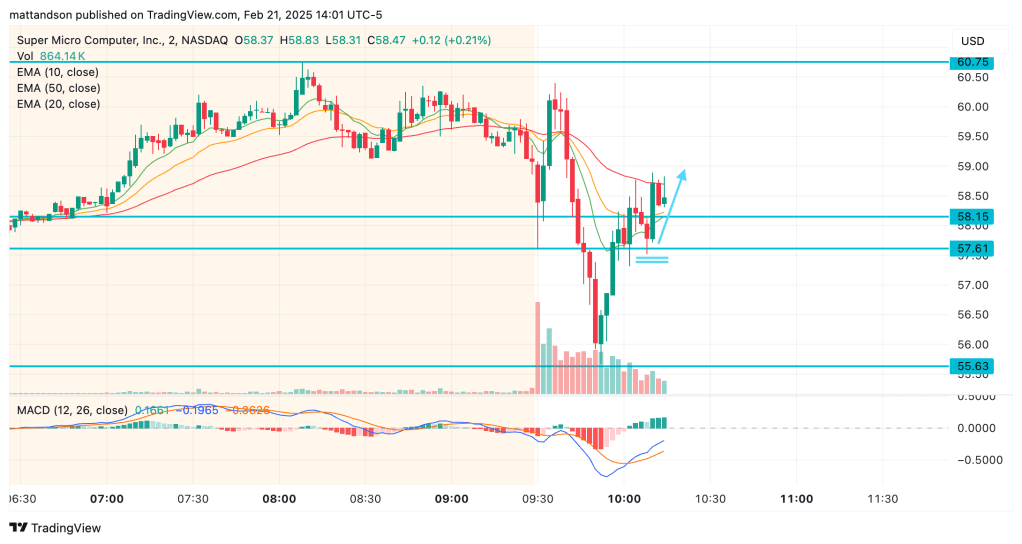
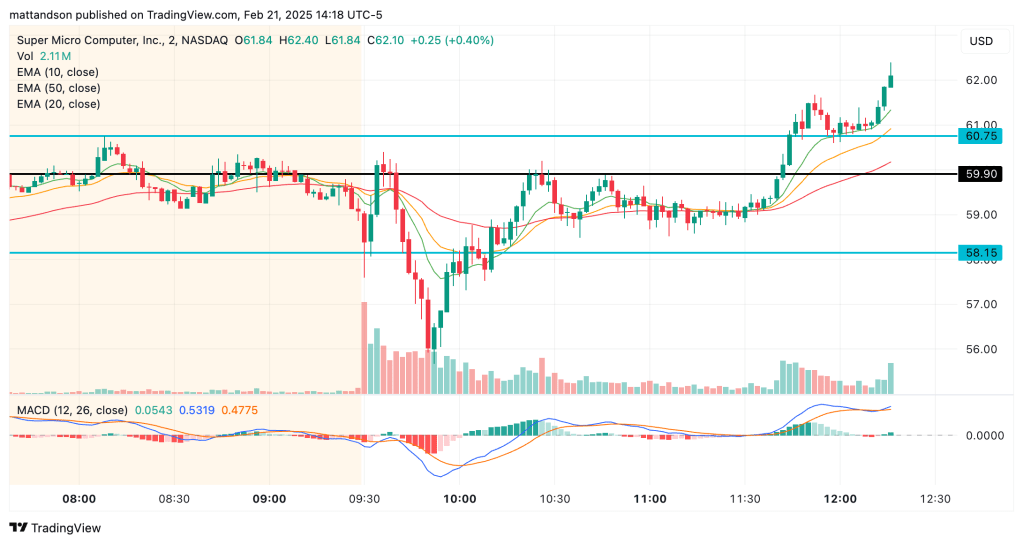
Technical: Re-tests support, then bounces on big green candle off 10 EMA. 10 EMA is now support, 50 EMA is now resistance.
Analysis: Uptrend bias, but watch how it acts with the 50 EMA resistance. Let’s see if it can break above it, or if it struggles. If it struggles, that can mean that buying isn’t as strong as I thought.
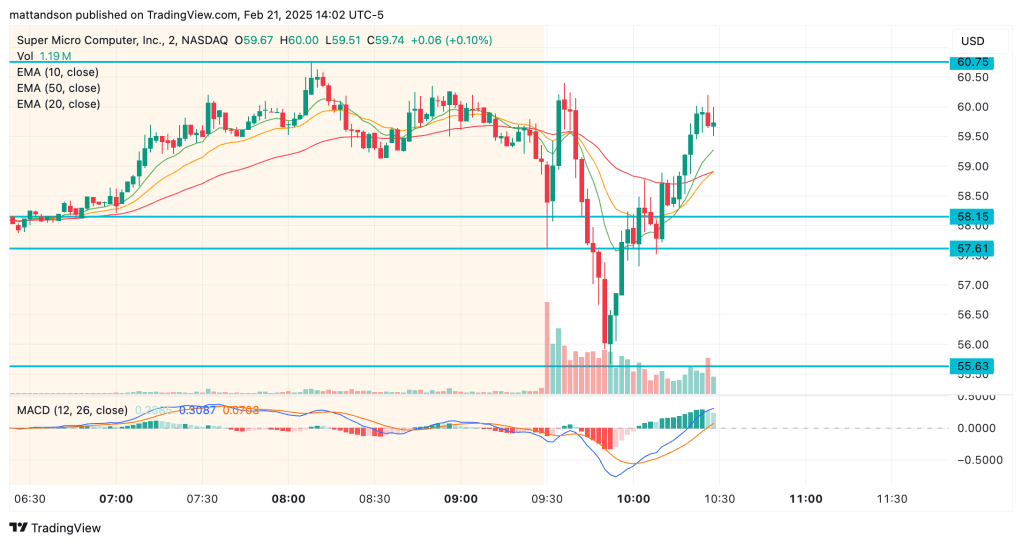
Boom!
Technical: Breaks through 50 EMA resistance, now riding 10 EMA in uptrend.
Analysis: Hold. Buying is strong. There’s a potential double top coming up, so watch it there.
New mental stop loss: Below the third-to-bottom line.
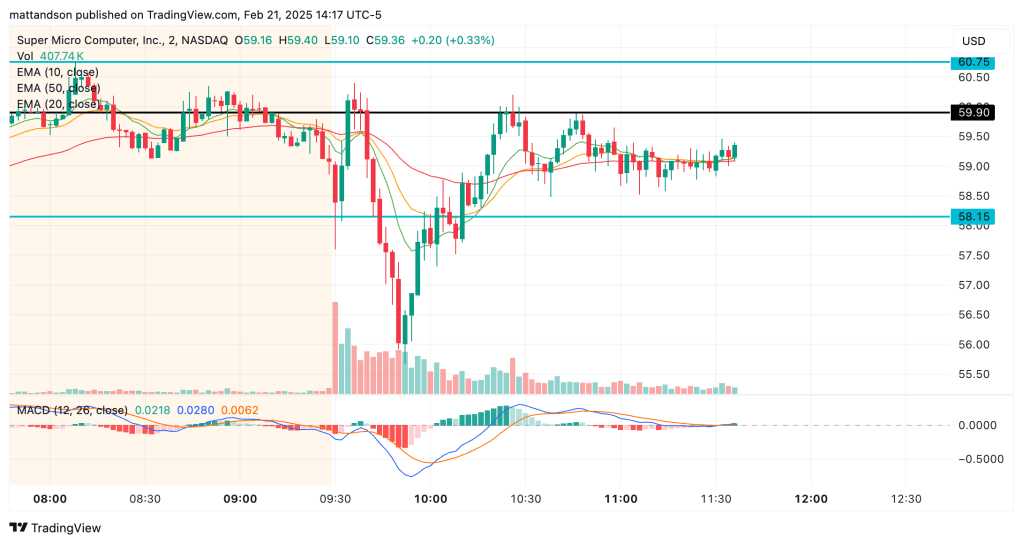
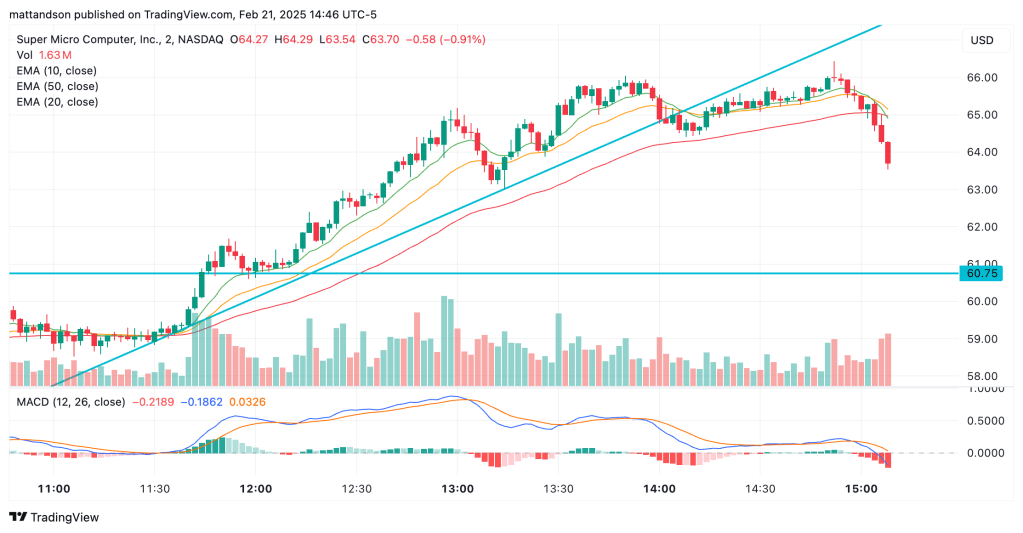
Technical: Double tops, but very short leg down into consolidation. Likely forming support since it’s in higher range of price. Black line drawn at the top of the consolidation, waiting for breakout above it.
Analysis: Upward bias. There’s slight indecision, but likely that buyers are accumulating. Watch it bounce at the 50 EMA for confirmation. Watch MACD for upcurl as well.
Boom! Breaks out of consolidation and upper resistance. That’s a strong stock.
New mental stop loss: Black line
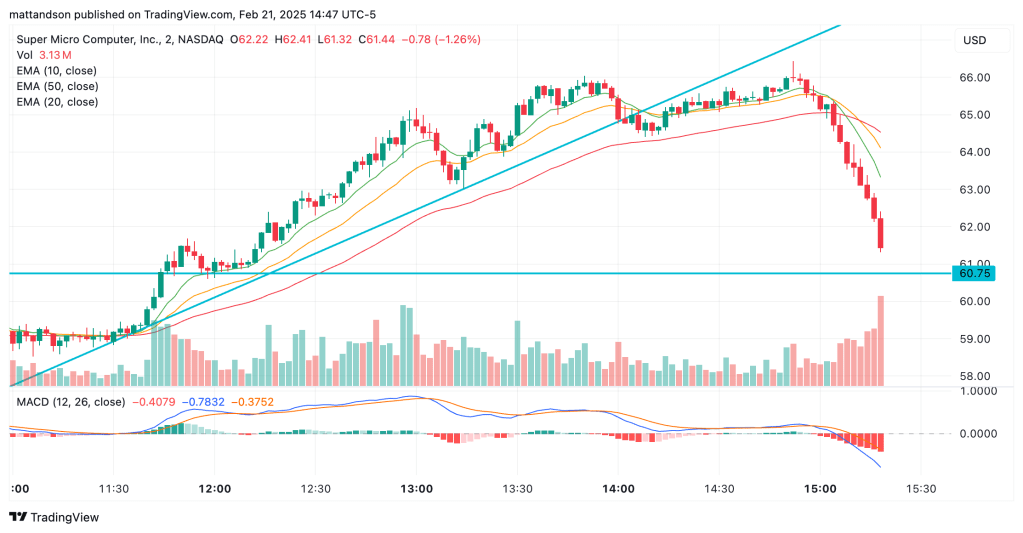
Retests upper resistance a little, then up. Upper resistance is now support.
New mental stop loss: Top blue line
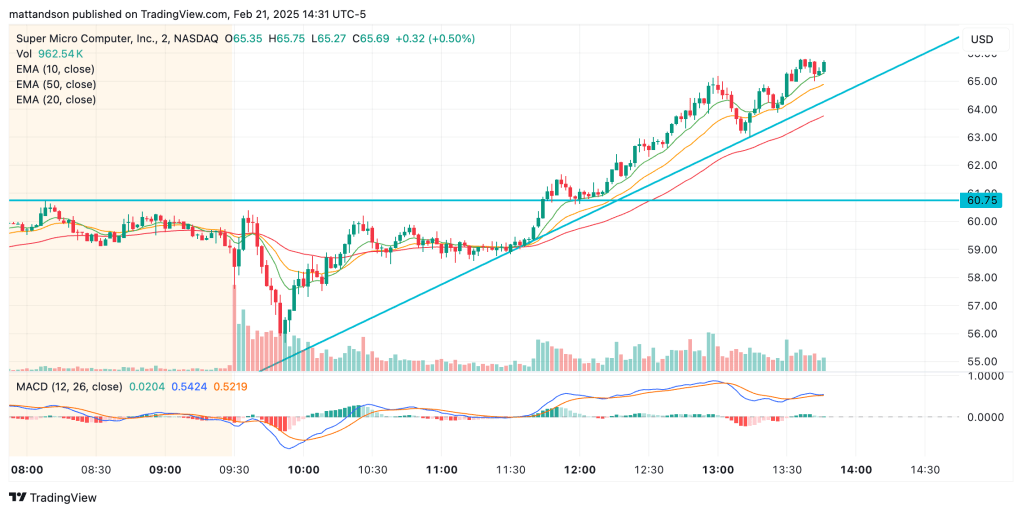
Riding this up, bouncing on 10 and 20 EMA (green and yellow). I draw a trend line under the move up.
New mental stop loss: When price dips below trend line, or touches 50 EMA.
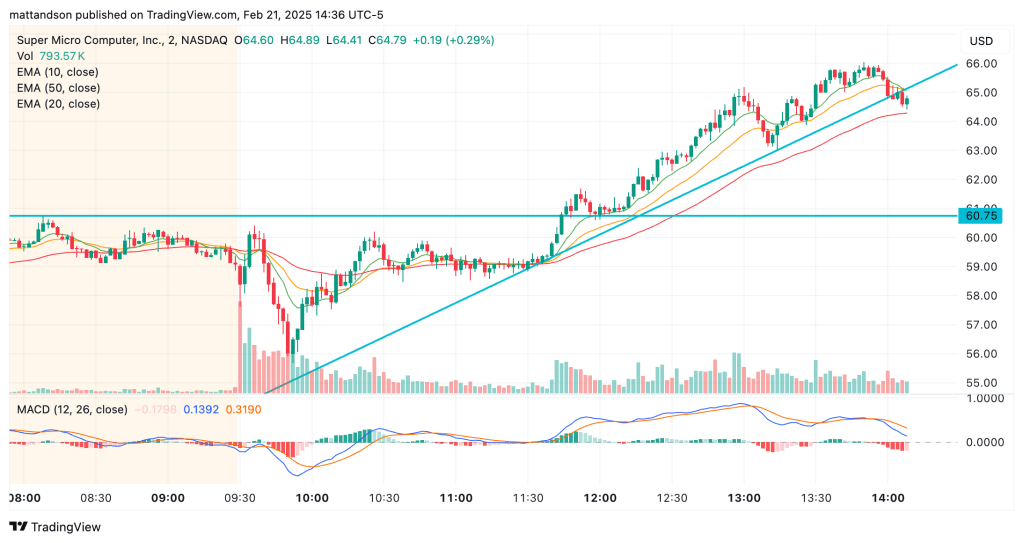
Technical: Price dips below trend line. Blows a kiss to 50 EMA. MACD curling down below its midline. EMAs curling down.
Analysis: EXIT. Price failed to break at $66, so who knows how much profit taking will begin to take place, especially after a multi-day run.
Even though I’m out, I’m still hanging around the charts. Price drifts back into $66, so now I’m kinda kicking myself for selling early. When all of a sudden…
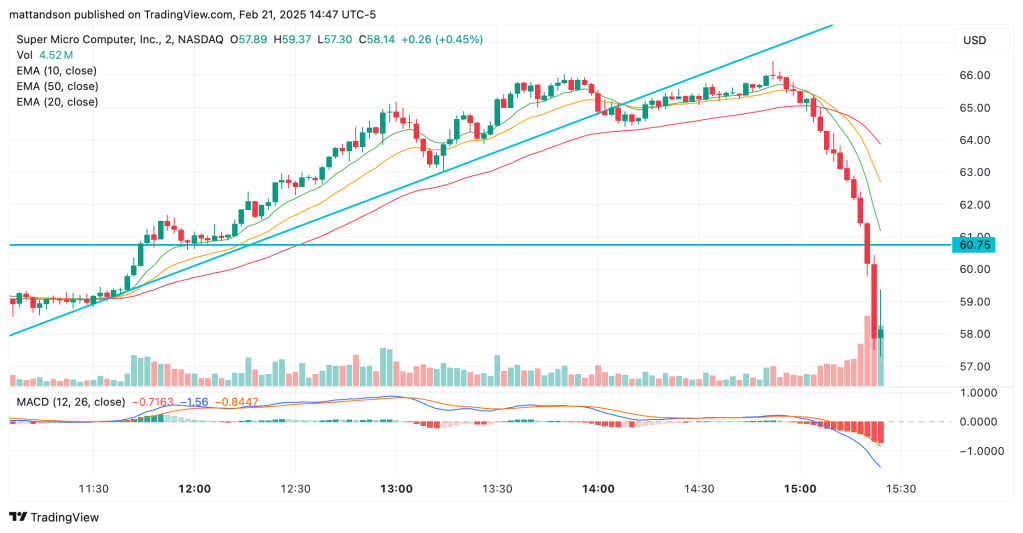
BOOOM. This was an insane, 15.8% rugpull. I didn’t know what happened. Neither did the TradingView comments, or anyone on the internet at this point. All I knew was that that trend line saved me. I easily could’ve had my most frustrating day in the market yet, but instead, I got my best. Because of that damn beautiful trend line.
Thank you God for the wins, and the lessons.

Leave a comment