Thesis: Tesla next stop: $170
Basis: Tesla respects trend lines and fibonacci levels. I’ve seen price run up 5-7% in a few minutes just to tap a trend line before reversing. (I think algos dominate this stock, which can favor technical analysis).
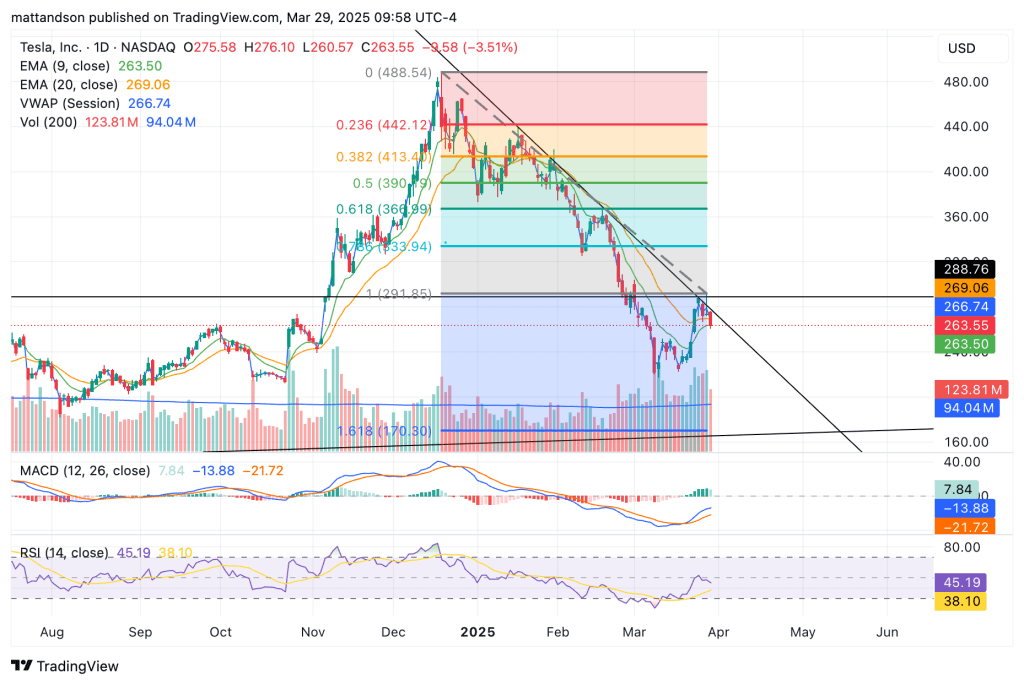
Tech Indicator 1: A descending trend line established 2-3 months ago is in tact. Price has recently touched it, got rejected, and is continuing descent.
Tech Indicator 2 (Confluence): A trend fibonacci shows that price in a downtrend will go back up to tap a fib level before continuing down. It skipped a retest of the 0.766 line recently, but it did that historically as well (look across, to the left). Returning to this price requires a break of trend line, which Tesla likely won’t do.
Indicator 1: MACD in bearish territory. Negative value, positive momentum slowing (fake out). This suggests that recent ascent may have been a stall in selling, not the beginning of buying.
Indicator 2 (Confluence): RSI was oversold, so it may have needed adjustment before continuing descent. Rejected at 50 line and pointing down, bearish bias.
Probability of $170 target: 60-70%

Leave a comment